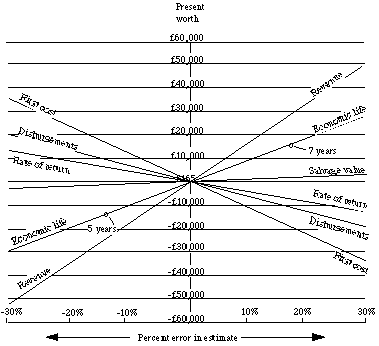
Sensitivity Analysis

Sensitivity analysis is useful in consideration of the consequences of using faulty data in, say, forecasting costs/cash flows. It involves speculation on alternative scenarios and estimating the accuracy of data, e.g. Optimistic estimate - Pessimistic estimate - most likely estimate.
The graph shown above is used in sensitivity analysis. Steeper curves indicate a higher degree of sensitivity to deviations from the original estimates.
References
- JL Riggs, Production Systems, Wiley, 1987. pp147-149
Find us on


