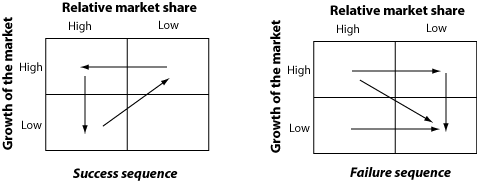
Boston Plot
A way of visualising the idea of product life cycle in terms of market share and growth.
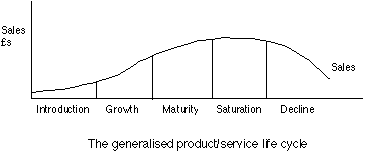
Product Life Cycle
A graphic visualisation of the 'life cycle' of a product that shows the relationship between sales and time. It can also be drawn to compare time, costs and revenue etc.
References
- Production Operations Management, Terry Hill; PHI, 1983.
- Production Systems; J L Riggs, Wiley, 1987.
Find us on
![]()
![]()
![]()
![]()
![]()
![]()
![]()