Analysis of Morrison’s Egg Carbon Calculation System
Project Overview
Morrison’s has been working closely with Eggbase Ltd to calculate the environmental impact of egg production through multiple of its supplier farms, and has requested for an independent verification of the data and calculations that feed the software model. Given that this is all strictly confidential data, owned by Eggbase, Morrison’s could not analyse it directly, which is why it has contracted the University of Cambridge to act as a trusted third party.
Approach
The report team reviewed all the documentation associated with the data collection and carbon calculation of the egg impact. This included the decision making used to model the egg production, the assumptions made, and the boundary chosen. In collaboration with Eggbase, the choice of databases and data points used to convert utilities and supplies quantities into carbon values was assessed.
A life cycle diagram was built with the Morrison’s and Eggbase staff to determine where boundary points had been identified and used in the calculations, and if those points could have been selected differently and the implications of those alternative choices. The most important areas for development of real-life data were considered, and any risks inherent in using generic data instead.
The real carbon data calculated through Eggbase for a set of flocks that has already been depleted was analysed, and for which Eggbase has access to information from packing stations for outputs, and all inputs used throughout the flock life.
Objectives
The overall objective is for Morrison’s to understand which decisions in the supply chain of eggs can reduce the carbon impact of the final product. Ultimately, these calculations will support Morrison’s in making claims directly to the end consumer on the impact of its eggs, and contribute to the Company’s carbon reduction goals.
Reference framework
Overview
This analysis is not a full LCA, however given that the core of the analysis is the verification of a carbon calculation software, which is based on LCA methodology, the analysis is based on LCA standards, which are listed in this section.
Eggbase System Analysis
Functional Unit of Analysis
The unit of analysis (UoA) for this work is the total impact of 1 specific flock, at a specific producer location, which will therefore define the carbon impact of 1kg of eggs. The impact is calculated based on inputs and outputs for a flock, throughout its entire productive life.
Definition of system boundary chosen
Sources of environmental impact across the lifecycle of the chicken can be:
- Organic raw material: these include types of feed, water, and supplements
- Inorganic raw materials: these include medicines, materials used for machinery and buildings.
- Utilities: [this is a term widely used in LCA analysis, which comprises] water, transportation, electricity etc.
The different types of impact are summarised in Figure 1 below:
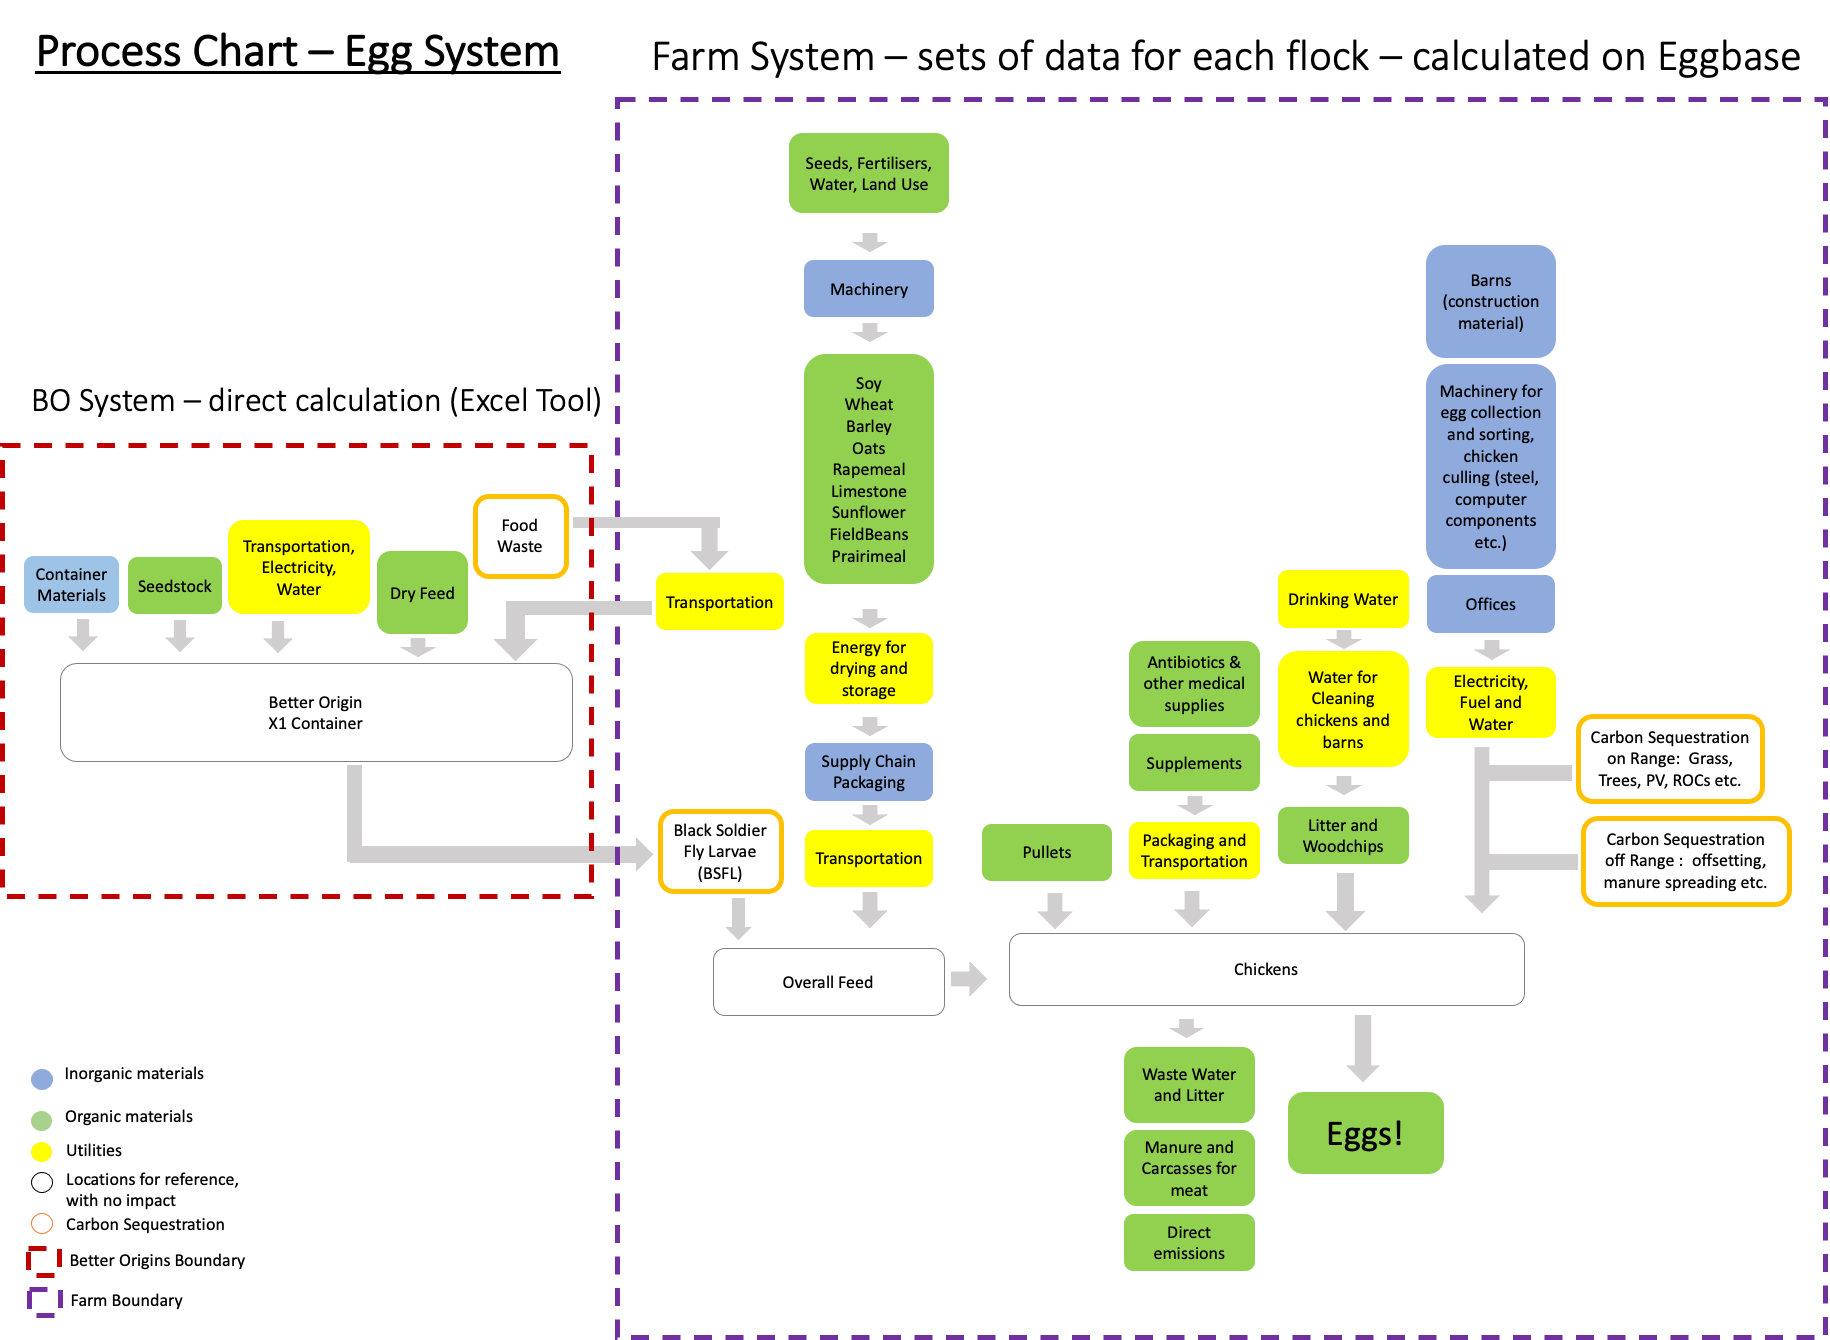
Figure 1 LCA Boundaries, types of impact sources (right click and open image in a new tab to view in detail)
Systems for allocation of emissions
In LCA methodology and in this report, emissions can be considered as one of the following:
- Negative values, therefore considered as avoided emissions, which are included in calculations
- Excluded values, therefore considered as zero (0) in a system
- Positive values, that are included
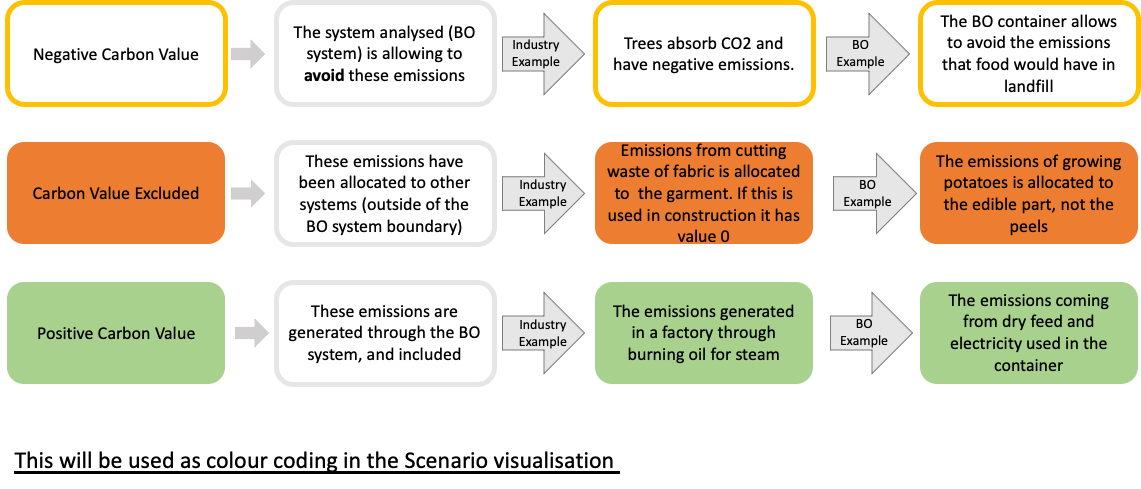
Figure 2 LCA allocation options (right click and open image in a new tab to view in detail)
Egg System Boundaries
Boundaries used in the calculation of the carbon impact by Eggbase are defined in Figure 2, based on what is included in the software, and interviews with the Eggbase team. These correspond to a cradle to farm gate system, which is correct for the purpose of the software. Therefore, everything which enters or used directly in the farm boundary is included in calculations.
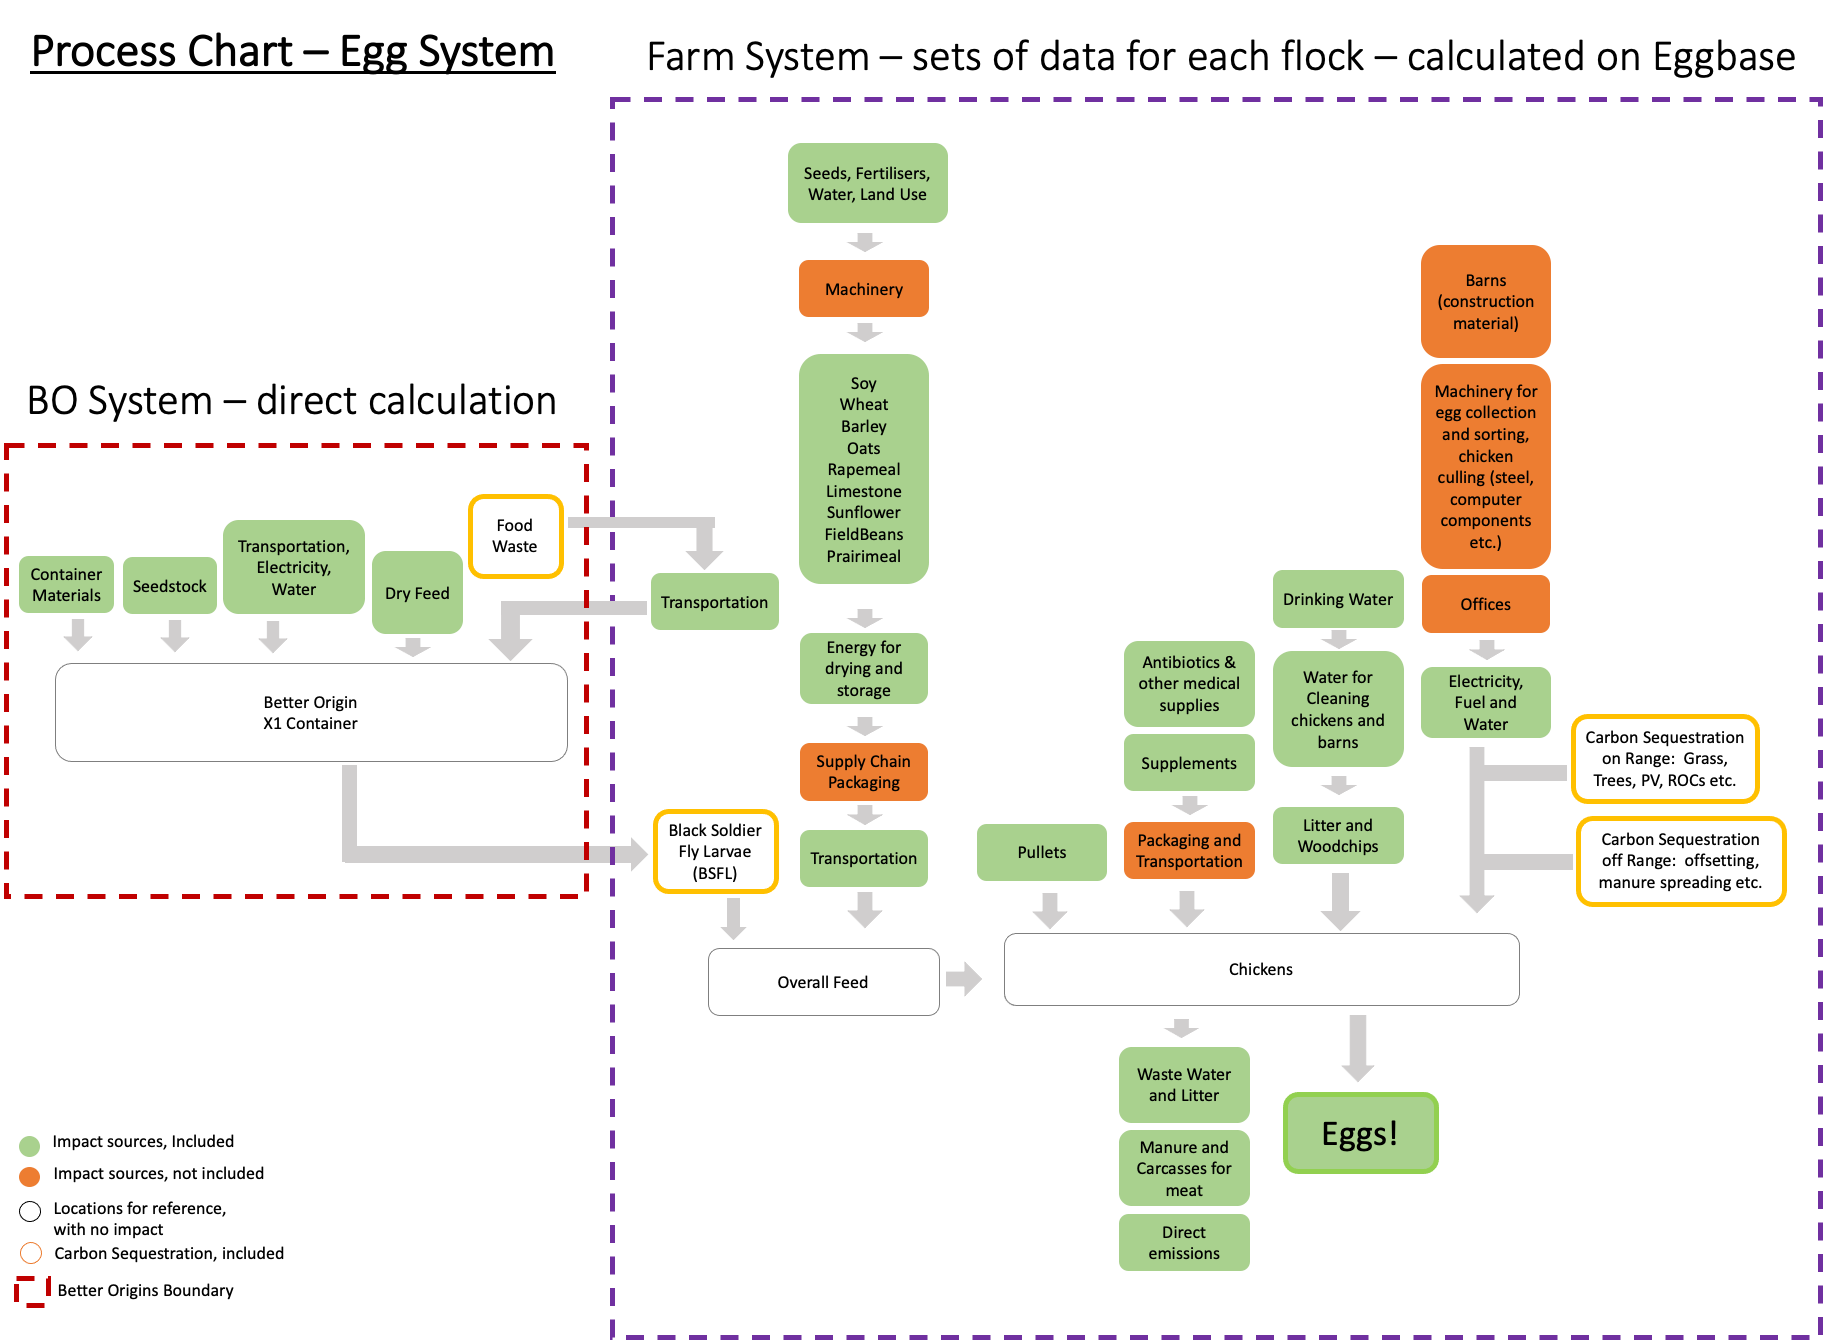
Figure 3 LCA Boundaries, inclusions and exclusions (right click and open image in a new tab to view in detail)
Boundary conclusions
Carbon emissions changes from different boundary inclusions:
- Barns: can be excluded
- Waste from packaging: negligible
- Water treatment: approved boundary decisions.
As a conclusion, the unit of analysis, boundaries, and exclusions match the guidelines in the Reference Framework, and a reality that can summarise the standard systems used in farms across the UK. The excluded elements would not bring a large variation to the final results, as they would account to less than 1% of carbon emissions.
Eggbase Assumptions
Assumption conclusions
After detail analysis, we assess that all the assumptions used by the Eggbase software are correct for calculating the carbon impact of eggs from different farms.
LCA emission factors used
Data Points Conclusions
The Data Points chosen by Eggbase and used for calculations are all relevant to the carbon impact calculation, and can be considered correct for the purpose of the analysis. Alternative options would result in negligible differences.
Values relevant to the specific country of operations have been used when possible, which is best practice. The same data points have been used in the Excel tool to ensure aligning in the EF used for calculating impacts of the X1 container. An example is the grid electricity used at the farm site, which should be the same emission factor for the containers and the egg processing.
Scenarios for carbon reductions
There are multiple solutions that can be adopted to reduce the impact of eggs. The Scenario Testing tool used in parallel with the Eggbase software allows for different variables to be changed and analysed
Best Case Scenario modelled in Eggbase (Producer A)
Landfill Scenario, Carbon Neutral
The most carbon savings can be found in the example of the Producer A Soy Free flock, where renewable energy is available on site, the landfill scenario is used, and the larvae is used to substitute rapeseed. Additionally, this farm has ROCs which further reduce the impact of the eggs.
In this case, the total flock impact is carbon neutral, and so is the impact of the eggs. All the values are shown in the table below.
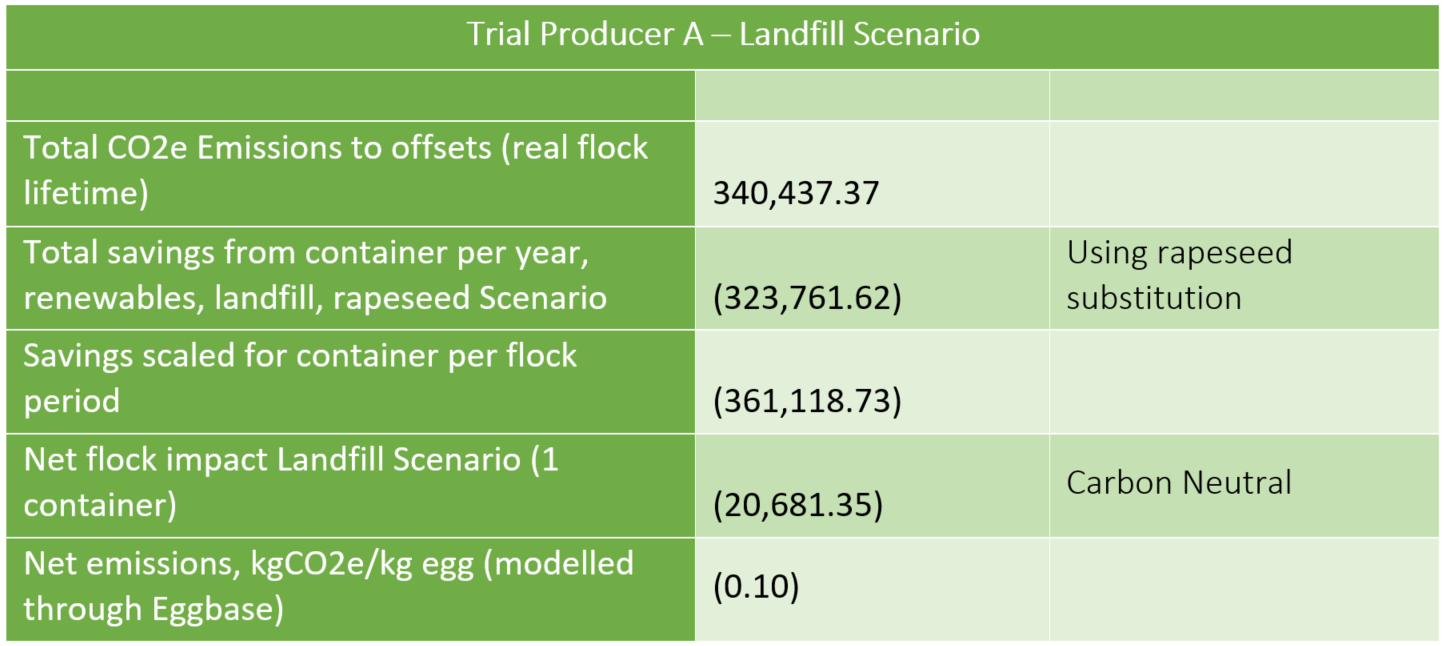
Table 7 Producer A Soy Free Landfill Scenario
Overall Conclusions
The Eggbase software has been analysed, and the boundaries, assumptions, databases and emission factors approved from the UoC team.
The key insight from this report is that carbon negative eggs seem to be possible, however they require systemic change across multiple farm variables, beyond the sole use of the Better Origins Ltd X1 container, which remains a key reduction solution.
Feed represents approximately 80% of the impact of eggs, which is why Morrison’s should encourage its farms to use low carbon feed options whenever possible, therefore rations that include the least amount of soy possible, and preferred feed alternatives, including organic feed, feed coming from countries with stricter agriculture guidance, such as the UK or the EU.
Regenerative agriculture has been identified by scientists globally as a key solution to tackle climate change, and although it is not an easy shift, Morrison’s could be a leader in the subject by supporting its farmers with this transition, with accompanying LCAs that can be used in the calculation of final product impacts, such as eggs, but also dairy and meat products.
The exemplary Producer A, which has the particular feature of a wind turbine on range, has been analysed, and with the change of its feed to have no soy, the result is a carbon neutral egg. The Producer A farm is currently throughout half of the life of a flock which is being fed 100% soy free. After depletion, it is highly advised to model on Eggbase, using direct data, how a X1 container would change the values of this real flock.
Another example is Producer B, which being much smaller can reach carbon neutrality with two containers when using the landfill scenario, at -0.18 kg CO2e/kg egg, starting from 2.68 kg CO2e/kg egg. The impact per kg of egg, however, remains 1.25 kg CO2e/kg egg when using only one container, which remains high, and it means that other variables can be improved in the farm. Using the AD scenario, this flock can still reduce its impact by 40% with two containers. The difference between this flock and one of a different size and age, shows that the size of the flock, choice of birds used, and age at depletion should be optimised to reduce the impact per egg, and modelled directly on Eggbase.
One X1 BO container can reduce the flock impact by around 30% without changing other variables in the farm, based on the example of Producer C, which is larger than Producer B, but starts from a lower impact per kg of egg, of 1.80 kg CO2e/kg egg. This solution is more easily implemented in the short term. In the longer term, changing the current system for supply of feed, the electricity sources used by the farm, and more containers are likely to be broadening the farms being able to approach net zero eggs.
More Information
The authors and contributors to this report include:
Ian Bamford, Commercial Director, Centre for Industrial Sustainability,
Institute for Manufacturing (IfM), University of Cambridge
t: +44 (0) 1223 768209 e:imb31@cam.ac.uk
Virginia Rollando, Researcher, Centre for Industrial Sustainability,
Institute for Manufacturing (IfM), University of Cambridge
Anne Fleck, Managing Director, Eggbase