Optimising the performance of Fibre Optic Sensors using Holography
Introduction
A Fibre Optic Sensor is a device in which a light signal, relayed using optical fibre, is modulated by some interaction with a physical, chemical, biological or other measurand. Offering unique advantages over conventional sensors, today, Fibre Optic Sensing has grown into a large scale industry.
With stringent requirements on sensors, much research is directed toward improving the performance of fibre optic sensors. In this research, our aim is to investigate if different fibre modes give rise to different sensing characteristics, and if so, how this may be used to improve sensor performance.
Holographic Mode Launch
Specific mode excitation or mode group excitation is achieved using a Holographic Launch scheme, see Figure 1. For a given fibre, the mode profiles are calculated by solving the scalar wave equation (in discrete form) as an Eigen problem. Then using Computer Generated Holography techniques, the modulations at the SLM which maximise the overlap integrals for each target mode determined. Thus, by careful control of the SLM, any mode or mode group can be excited selectively. This is confirmed by viewing the spatial distribution of the fibre output where discrete modes are clearly visible, see Figure 2.
For effective mode launch, the integrity of the replay field should be maintained at the scale of the fibre core. Exploiting the adaptive nature of the SLM, the holographic launch is capable of correcting for aberrations and misalignments by superimposing a correction phase pattern over the SLM modulation. This correction phase is formed of the first 35 Zernike polynomials weighted by coefficients determined frequently using an algorithm which minimises the spot size at the fibre input.
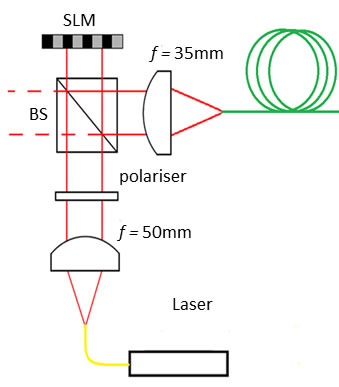
Figure 1 - Mode launch apparatus
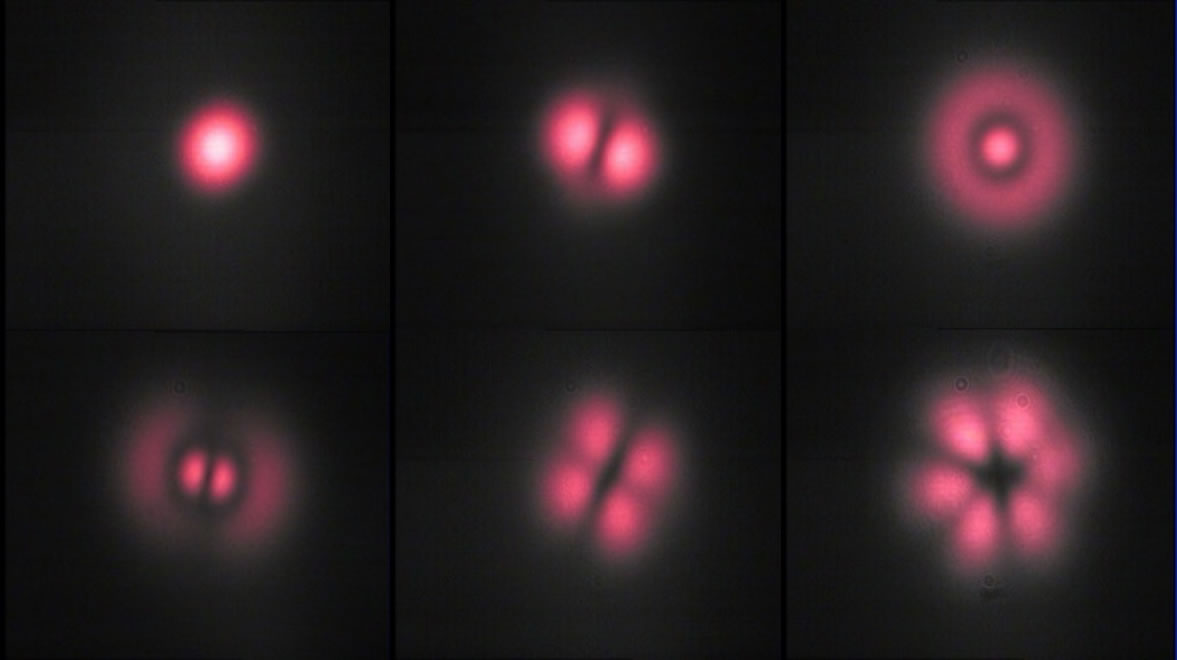
Figure 2 - Spatial distributions at fibre output with discrete modes excited
Results
Sensing is performed using Side Polished fibres. The depressed cladding yields an exposed evanescent field which interacts with analytes altering the fibre transmission.
Using a 32.5/125µm multi-mode side polished fibre, a spot is launched into various points across the fibre core (which excites different mode groups), and the difference in transmitted power with the depressed cladding placed in high and low refractive media measured. The colour map of Figure 3 shows this measured power difference, for the spot launched into each coordinate. The peak towards the edge of the fibre core corresponds to launch coordinates where the sensitivity can be maximised, and its existence demonstrates that sensing does depend on the excited mode groups within the fibre.
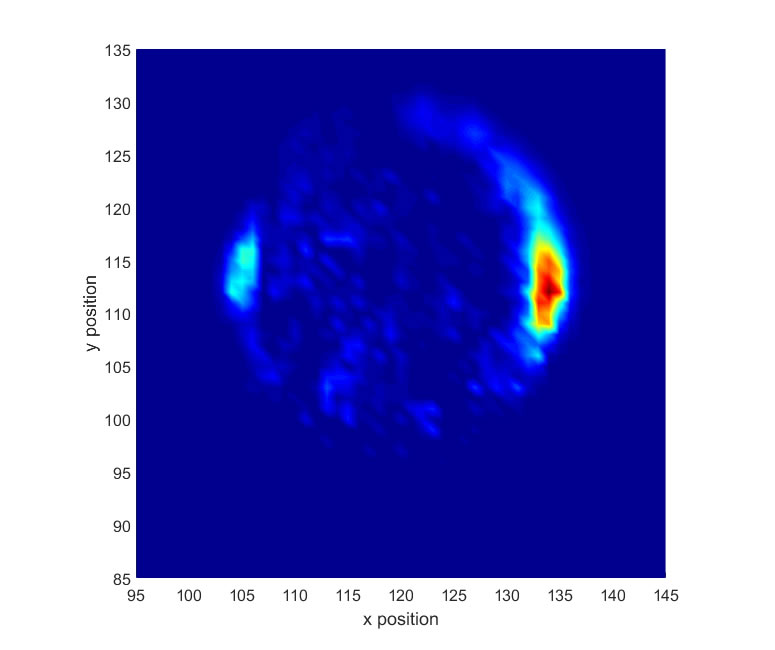
Figure 3 – Colormap of transmitted power difference between high and low index medium, for each offset launch coordinate
Similarly, each mode may also correspond to a different sensitivity. In Figure 4, the sensing results of a few-mode side polished fibre are plotted, where each mode is excited exclusively. The gradient of each line corresponds to the sensitivity of the mode, clearly demonstrating the modal dependence of the sensor performance.
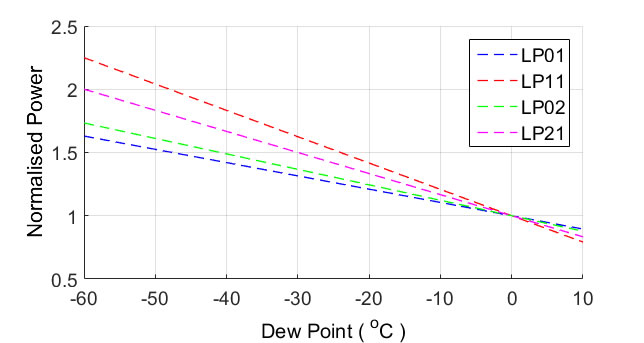
Figure 4 - Normalised power measurements for dew point sensing with power coupled into discrete fibre modes
Researcher
Funders